Earth Is Special. 🌎
Earth is special. 🌎
It's the only place in the universe that we know contains life. Celebrate its beauty by taking a look at these breathtaking images of our home planet.
Swirling white clouds, deep blue oceans, and multicolored landscapes come to life on the pages of our new photo essay "Earth," a collection of dramatic images captured by satellites. Make sure to follow us on Tumblr for your regular dose of space: http://nasa.tumblr.com.
More Posts from Nasa and Others
Uncovering a Massive Meteor Crater Found Lurking Under the Ice

For the first time ever, we've found a massive crater hiding under one of Earth's ice sheets. Likely caused by a meteor, it was uncovered in Greenland by a team of international scientists using radar data.

The data was collected by missions like our Operation IceBridge, which flies planes over Greenland and Antarctica to study the ice and snow at our planet’s poles.

In this case, the crater is near Hiawatha Glacier, covered by a sheet of ice more than half a mile thick. We're pretty sure that the crater was caused by a meteor because it has characteristics traditionally associated with those kinds of impacts, like a bowl shape and central peaks.

It’s also one of the 25 largest impact craters in the world, large enough to hold the cities of Paris or Washington, D.C. The meteor that created it was likely half a mile wide.

Currently, there’s still lots to learn about the crater – and the meteor that created it – but it’s likely relatively young in geologic timescales. The meteor hit Earth within the last 3 million years, but the impact could have been as recent as 13,000 years ago.

While it was likely smaller than the meteor credited with knocking out the dinosaurs, this impact could have potentially caused a large influx of fresh water into the northern Atlantic Ocean, which would have had profound impacts for life in the region at the time.

Go here to learn more about this discovery: https://www.nasa.gov/press-release/international-team-nasa-make-unexpected-discovery-under-greenland-ice

Operation IceBridge continues to uncover the hidden secrets under Earth's ice. IceBridge has been flying for 10 years, providing a data bridge between ICESat, which flew from 2003 to 2009, and ICESat-2, which launched in September. IceBridge uses a suite of instruments to help track the changing height and thickness of the ice and the snow cover above it. IceBridge also measures the bedrock below the ice, which allows for discoveries like this crater.
Make sure to follow us on Tumblr for your regular dose of space: http://nasa.tumblr.com
See Why Our Researchers Explore Earth's Extreme and Remote Environments

When we talk about exploration in far-flung places, you might think of space telescopes taking images of planets outside our solar system, or astronauts floating on the International Space Station.

But did you know our researchers travel to some of Earth's most inaccessible and dangerous places, too?

Two scientists working with the ICESat-2 mission just finished a trek from the South Pole to latitude 88 south, a journey of about 450 miles. They had to travel during the Antarctic summer - the region's warmest time, with near-constant sunshine - but the trek was still over solid ice and snow.

The trip lasted 14 days, and was an important part of a process known as calibration and validation. ICESat-2 will launch this fall, and the team was taking extremely precise elevation measurements that will be used to validate those taken by the satellite.

Sometimes our research in Earth's remote regions helps us understand even farther-flung locations…like other planets.

Geologic features on Mars look very similar to islands and landforms created by volcanoes here on our home planet.

As hot jets of magma make their way to Earth's surface, they create new rocks and land - a process that may have taken place on Mars and the Moon.

In 2015, our researchers walked on newly cooled lava on the Holuhraun volcano in Iceland to take measurements of the landscape, in order to understand similar processes on other rocky bodies in our solar system.

There may not be flowing lava in the mangrove forests in Gabon, but our researchers have to brave mosquitoes and tree roots that reach up to 15-foot high as they study carbon storage in the vegetation there.

The scientists take some measurements from airplanes, but they also have to gather data from the ground in one our of planet's most pristine rainforests, climbing over and around roots that can grow taller than people. They use these measurements to create a 3-D map of the ecosystem, which helps them understand how much carbon in stored in the plants.

You can follow our treks to Earth’s most extreme locales on our Earth Expeditions blog.
Make sure to follow us on Tumblr for your regular dose of space: http://nasa.tumblr.com
Celebrate Earth Day with NASA

"We came all this way to explore the Moon, and the most important thing is that we discovered the Earth." - Apollo 8 astronaut Bill Anders
On Dec. 24, 1968, Anders snapped this iconic photo of "Earthrise" during the historic Apollo 8 mission. As he and fellow astronauts Frank Borman and Jim Lovell became the first humans to orbit the Moon, they witnessed Earth rising over the Moon's horizon. The image helped spark the first #EarthDay on April 22, 1970.
Anders sat down with Dr. Kate Calvin, our chief scientist and senior climate advisor, to chat about the photo, and NASA’s role in studying our home.
Make sure to follow us on Tumblr for your regular dose of space!
Tracking a Warming Arctic – From Underground to High in the Sky
The Arctic is warming much faster than the rest of Earth. This warming is creating big and small changes, some of which could ripple beyond the planet’s frozen regions and affect us world-wide – possibly raising sea levels, increasing greenhouse warming and affecting wildlife.
Our Arctic Boreal Vulnerability Experiment, known as ABoVE, just began a 10-year mission in Alaska and western Canada, studying these changes.
Underground: Permafrost is the layer of frozen soil beneath some Arctic forests and tundra.

Like the name suggests, this icy layer stays solid year-round, so when it does melt, it can create big problems. The soil above the thawing permafrost can collapse, creating this wobbly, unstable surface.
7 feet above sea level: As the permafrost thaws, the soil above it can fall away.

Along the banks of the Itkillik River in Alaska, thawing permafrost has dripped into the water, eroding the cliff side. Known as the “Stinky Bluffs,” this permafrost contains lots of frozen organic matter from dead plants and animals. As the permafrost thaws, this organic matter doesn’t just smell, it also releases carbon dioxide and methane into the atmosphere, adding to the warming effect.
446 feet above sea level: Wildfires aren’t unusual in the forests and shrub lands of Alaska, but as the climate continues to warm, they burn longer and do more damage.

People who live off the land in the region help researchers understand where plant life isn’t growing back after fires.
100-1000 feet above sea level: Researchers set up 100-foot tall towers at strategic locations throughout Alaska to measure carbon dioxide and methane emissions from right above the forest canopy.

This provides an up-close look at what gases are released or absorbed from the trees, or swirl in from neighboring regions. These data are combined with measurements taken from airplanes and satellites to create a clearer picture of how much carbon is entering the atmosphere.
3,369 feet above sea level: Dall sheep live in several Alaskan mountain ranges, where they’re critical to both the tourism and sports hunting economies.

Credit: National Park Service
Changes in temperature and vegetation can profoundly affect their behavior, like grazing habits, and so researchers study how changing plant life and snow cover affect the sheep.
100-30,000 feet above sea level: Carbon emissions in the air come from thawing permafrost, fossil fuel burning, decaying vegetation and wildfires burning across the Arctic-boreal regions.

One experiment in the ABoVE campaign measures these emissions with instruments on a DC-8 plane.
About 30,000 feet about sea level: When wildfires burn through vegetation, the effects extend far beyond what we see on the ground.

Fires release carbon stored in the plants into the atmosphere, where it affects air quality and contributes to the greenhouse effect.
438 miles: Our ABoVE campaign combines research on the ground and from planes with data collected by a fleet of Earth-observing satellites, orbiting Earth hundreds of miles above the surface.

Data from these satellites provides information on vegetation, atmospheric particles and gasses, and how humans are impacting our planet. With all these data sets analyzed by computer programs, the result is a comprehensive picture of our warming planet.
Make sure to follow us on Tumblr for your regular dose of space: http://nasa.tumblr.com
Did the training ever get so hard that you would regret getting into this?
No because the end goal is space!
The Search for Starless Planets
While it’s familiar to us, our solar system may actually be a bit of an oddball. Our Milky Way galaxy is home to gigantic worlds with teeny-tiny orbits and planets that circle pairs of stars. We’ve even found planets that don’t orbit stars at all! Instead, they drift through the galaxy completely alone (unless they have a moon to keep them company). These lonely island worlds are called rogue planets.

Where do rogue planets come from?
The planet-building process can be pretty messy. Dust and gas around a star clump together to form larger and larger objects, like using a piece of play-dough to pick up other pieces.
Sometimes collisions and close encounters can fling a planet clear out of the gravitational grip of its parent star. Rogue planets may also form out in space on their own, like the way stars grow.

Seeing the invisible
We’ve discovered more than 4,000 exoplanets, but only a handful are rogue planets. That’s because they’re superhard to find! Rogue planets are almost completely invisible to us because they don’t shine like stars and space is inky black. It’s like looking for a black cat in a dark room without a flashlight.
Some planet-finding methods involve watching to see how orbiting planets affect their host star, but that doesn’t work for rogue planets because they’re off by themselves. Rogue planets are usually pretty cold too, so infrared telescopes can’t use their heat vision to spot them either.
So how can we find them? Astronomers use a cool cosmic quirk to detect them by their effect on starlight. When a rogue planet lines up with a more distant star from our vantage point, the planet bends and magnifies light from the star. This phenomenon, called microlensing, looks something like this:

Imagine you have a trampoline, a golf ball, and an invisible bowling ball. If you put the bowling ball on the trampoline, you could see how it made a dent in the fabric even if you couldn’t see the ball directly. And if you rolled the golf ball near it, it would change the golf ball’s path.

A rogue planet affects space the way the bowling ball warps the trampoline. When light from a distant star passes by a rogue planet, it curves around the invisible world (like how it curves around the star in the animation above). If astronomers on Earth were watching the star, they’d notice it briefly brighten. The shape and duration of this brightness spike lets them know a planet is there, even though they can’t see it.

Telescopes on the ground have to look through Earth’s turbulent atmosphere to search for rogue planets. But when our Nancy Grace Roman Space Telescope launches in the mid-2020s, it will give us a much better view of distant stars and rogue planets because it will be located way above Earth’s atmosphere — even higher than the Moon!
Other space telescopes would have to be really lucky to spot these one-in-a-million microlensing signals. But Roman will watch huge patches of the sky for months to catch these fleeting events.

Lessons from cosmic castaways
Scientists have come up with different models to explain how different planetary systems form and change over time, but we still don’t know which ones are right. The models make different predictions about rogue planets, so studying these isolated worlds can help us figure out which models work best.
When Roman spots little microlensing starlight blips, astronomers will be able to get a pretty good idea of the mass of the object that caused the signal from how long the blip lasts. Scientists expect the mission to detect hundreds of rogue planets that are as small as rocky Mars — about half the size of Earth — up to ones as big as gas giants, like Jupiter and Saturn.

By design, Roman is only going to search a small slice of the Milky Way for rogue planets. Scientists have come up with clever ways to use Roman’s future data to estimate how many rogue planets there are in the whole galaxy. This information will help us better understand whether our solar system is pretty normal or a bit of an oddball compared to the rest of our galaxy.

Roman will have such a wide field of view that it will be like going from looking at the cosmos through a peephole to looking through a floor-to-ceiling window. The mission will help us learn about all kinds of other cool things in addition to rogue planets, like dark energy and dark matter, that will help us understand much more about our place in space.
Learn more about the Roman Space Telescope at: https://roman.gsfc.nasa.gov/

Make sure to follow us on Tumblr for your regular dose of space: http://nasa.tumblr.com
🔎 Lava Lake Discovery
🌋 Raikoke Volcano Eruption
🔥 Uptick in Amazon Fire Activity
2019 brought many memorable events on Planet Earth, and NASA satellites and astronauts captured a lot of the action! From new discoveries to tracking natural events and capturing amazing scenery, here are a few highlights from around the globe.
Read more about the images in this video, here.
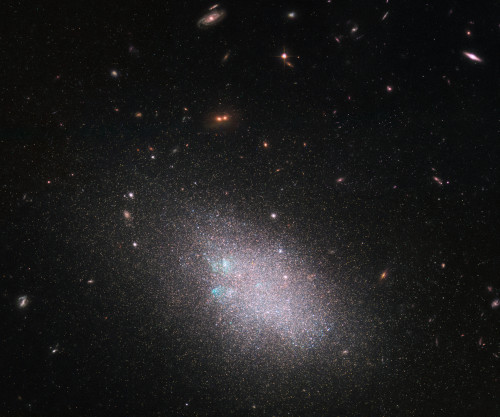
Look! A cosmic block party 🥳 In this Hubble image, you’ll find 50 spiral and dwarf galaxies hanging out in our cosmic neighborhood. The main focal point of stars is actually a dwarf galaxy. Dwarf galaxies often show a hazy structure, an ill-defined shape and an appearance somewhat akin to a swarm or cloud of stars — and UGC 685 is no exception to this. These data were gathered under Hubble’s Legacy ExtraGalactic UV Survey (LEGUS) program, the sharpest and most comprehensive ultraviolet survey of star-forming galaxies in the nearby universe. Image Credit: ESA/Hubble & NASA; the LEGUS team, B. Tully, D. Calzetti
Make sure to follow us on Tumblr for your regular dose of space: http://nasa.tumblr.com
NASA’s 60th Anniversary: Trailblazing Technology
Technology drives exploration. For 60 years, we have advanced technology to meet the rigorous needs of our missions. From GPS navigation to water filtration systems, our technologies developed for space improve your daily life on Earth. We continue to innovate and explore. Since we opened for business on Oct. 1, 1958, our history tells a story of exploration, innovation and discoveries. The next 60 years, that story continues. Learn more: https://www.nasa.gov/60
Make sure to follow us on Tumblr for your regular dose of space: http://nasa.tumblr.com.
From Microscopic to Multicellular: Six Stories of Life that We See from Space
Life. It's the one thing that, so far, makes Earth unique among the thousands of other planets we've discovered. Since the fall of 1997, NASA satellites have continuously and globally observed all plant life at the surface of the land and ocean. During the week of Nov. 13-17, we are sharing stories and videos about how this view of life from space is furthering knowledge of our home planet and the search for life on other worlds.

Earth is the only planet with life, as far as we know. From bacteria in the crevices of the deepest oceans to monkeys swinging between trees, Earth hosts life in all different sizes, shapes and colors. Scientists often study Earth from the ground, but some also look to our satellites to understand how life waxes and wanes on our planet.
Over the years, scientists have used this aerial view to study changes in animal habitats, track disease outbreaks, monitor forests and even help discover a new species. While this list is far from comprehensive, these visual stories of bacteria, plants, land animals, sea creatures and birds show what a view from space can reveal.
1. Monitoring the single-celled powerhouses of the sea

Known as the grass of the ocean, phytoplankton are one of the most abundant types of life in the ocean. Usually single-celled, these plant-like organisms are the base of the marine food chain. They are also responsible for the only long-term transfer of carbon dioxide from Earth’s atmosphere to the ocean.
Even small changes in phytoplankton populations can affect carbon dioxide concentrations in the atmosphere, which could ultimately affect Earth’s global surface temperatures. Scientists have been observing global phytoplankton populations continuously since 1997 starting with the Sea-Viewing Wide Field-of View Sensor (SeaWiFS). They continue to study the small life-forms by satellite, ships and aircrafts.
2. Predicting cholera bacteria outbreaks
Found on the surface of zooplankton and in contaminated water, the bacteria that cause the infectious disease cholera — Vibrio cholerae — affect millions of people every year with severe diarrhea, sometimes leading to death. While our satellite sensors can’t detect the actual bacteria, scientists use various satellite data to look for the environmental conditions that the bacteria thrive in.
Specifically, microbiologist Rita Colwell at the University of Maryland, College Park, and West Virginia University hydrologist Antar Jutla studied data showing air and ocean temperature, salinity, precipitation, and chlorophyllconcentrations, the latter a marker for zooplankton. Anticipating where the bacteria will bloom helps researchers to mitigate outbreaks.

Recently, Colwell and Jutla have been able to estimate cholera risk after major events, such as severe storms, by looking at satellite precipitation data, air temperature, and population maps. The two maps above show the team's predicted cholera risk in Haiti two weeks after Hurricane Matthew hit over October 1-2, 2016 and the actual reported cholera cases in October 2016.
3. Viewing life on land
From helping preserve forests for chimpanzees to predicting deer population patterns, scientists use our satellites to study wildlife across the world. Satellites can also see the impacts of perhaps the most relatable animal to us: humans. Every day, we impact our planet in many ways including driving cars, constructing buildings and farming – all of which we can see with satellites.

Our Black Marble image provides a unique view of human activity. Looking at trends in our lights at night, scientists can study how cities develop over time, how lighting and activity changes during certain seasons and holidays, and even aid emergency responders during power outages caused by natural disasters.
4. Tracking bird populations
Scientists use our satellite data to study birds in a variety of ways, from understanding their migratory patterns, to spotting potential nests, to tracking populations. In a rather creative application, scientists used satellite imagery to track Antarctica’s emperor penguin populations by looking for their guano – or excrement.

Counting emperor penguins from the ground perspective is challenging because they breed in some of the most remote and cold places in the world, and in colonies too large to easily count manually. With their black and white coats, emperor penguins are also difficult to count from an aerial view as they sometimes blend in with shadows on the ice. Instead, Phil Trathan and his colleagues at the British Antarctic Survey looked through Landsat imagery for brown stains on the sea ice. By looking for penguin droppings, Trathan said his team identified 54 emperor penguin colonies along the Antarctic coast.
5. Parsing out plant life
Just as we see plants grow and wilt on the ground, satellites observe the changes from space. Flourishing vegetation can indicate a lively ecosystem while changes in greenery can sometimes reveal natural disasters, droughts or even agricultural practices. While satellites can observe plant life in our backyards, scientists can also use them to provide a global picture.

Using data from satellites including SeaWiFS, and instruments including the NASA/NOAA Visible Infrared Imaging Radiometer Suite and the Moderate Resolution Imaging Spectroradiometer, scientists have the most complete view of global biology to date, covering all of the plant life on land and at the surface of the ocean.
6. Studying life under the sea
Our satellites have helped scientists study creatures living in the oceans whether it’s finding suitable waters for oysters or protecting the endangered blue whale. Scientists also use the data to learn more about one of the most vulnerable ecosystems on the planet – coral reefs.

They may look like rocks or plants on the seafloor, but corals are very much living animals. Receiving sustenance from photosynthetic plankton living within their calcium carbonate structures, coral reefs provide food and shelter for many kinds of marine life, protect shorelines from storms and waves, serve as a source for potential medicines, and operate as some of the most diverse ecosystems on the planet.

However, coral reefs are vulnerable to the warming of the ocean and human activity. Our satellites measure the surface temperature of ocean waters. These measurements have revealed rising water temperatures surrounding coral reef systems around the world, which causes a phenomenon known as “coral bleaching.” To add to the satellite data, scientists use measurements gathered by scuba divers as well as instruments flown on planes.
During the week of Nov. 13-17, check out our stories and videos about how this view of life from space is furthering knowledge of our home planet and the search for life on other worlds. Follow at www.nasa.gov/Earth.
Make sure to follow us on Tumblr for your regular dose of space: http://nasa.tumblr.com.
-
 itsupforubaby reblogged this · 4 years ago
 -
 excsakazalnevem liked this · 4 years ago
 -
 caffeinatedvampireslayer liked this · 5 years ago
 -
 whitetiger94things reblogged this · 5 years ago
 -
 wecanseethemadness reblogged this · 5 years ago
 -
 pumpkinylink reblogged this · 5 years ago
 -
pumpkinylink liked this · 5 years ago
-
 thnks-fr-th-samulet liked this · 5 years ago
Explore the universe and discover our home planet with the official NASA Tumblr account
1K posts